
Clouds from Top to Bottom
By Patrick L. Barry
During the summer and fall of 2006, U.S. Coast Guard planes flew over the North Pacific in search of illegal, unlicensed, and unregulated fishing boats. It was a tricky operationin part because low clouds often block the pilots' view of anything floating on the ocean surface below.
To assist in these efforts, they got a little help from the stars.
Actually, it was a satelliteCloudSat, an experimental NASA mission to study Earths clouds in an entirely new way. While ordinary weather satellites see only the tops of clouds, CloudSats radar penetrates clouds from top to bottom, measuring their vertical structure and extent. By tapping into CloudSat data processed at the Naval Research Laboratory (NRL) in Monterey, CA, Coast Guard pilots were better able to contend with low-lying clouds that might have otherwise hindered their search for illegal fishing activity.
In the past, Coast Guard pilots would fly out over the ocean not knowing what visibility to expect. Now they can find out quickly. Data from research satellites usually takes days to weeks to process into a usable form, but NASA makes CloudSat's data publicly available on its QuickLook website and to users such as NRL in only a matter of hoursmaking the data useful for practical applications.
"Before CloudSat, there was no way to measure cloud base from space worldwide," says Deborah Vane, project manager for CloudSat at NASA's Jet Propulsion Laboratory.
CloudSats primary purpose is to better understand the critical role that clouds play in Earth's climate. But knowledge about the structure of clouds is useful not only for scientific research, but also to operational users such as Coast Guard patrol aircraft and Navy and commercial ships at sea.
"Especially when it's dark, theres limited information about storms at sea," says Vane. "With CloudSat, we can sort out towering thunderclouds from blankets of calmer clouds. And we have the ability to distinguish between light rain and rain that is falling from severe storms." CloudSats radar is much more sensitive to cloud structure than are radar systems operating at airports, and from its vantage point in space, Cloudsat builds up a view of almost the entire planet, not just one local area. "That gives you weather information that you don't have in any other way."
There is an archive of all data collected since the start of the mission in May 2006 on the CloudSat QuickLook website at cloudsat.atmos.colostate.edu. And to introduce kids to the fun of observing the clouds, go to spaceplace.nasa.gov/en/kids/cloudsat_puz.shtml.
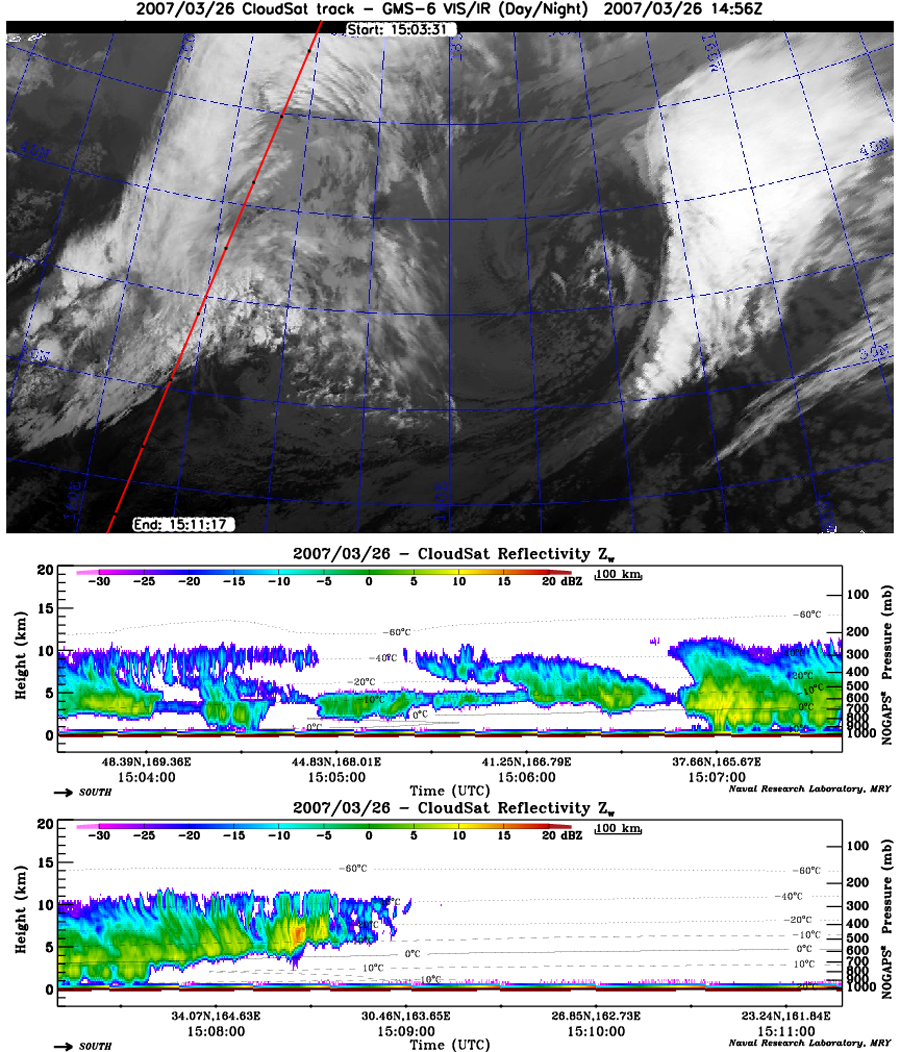
A CloudSat ground track appears as a red line overlaid upon a GMS-6 (a Japanese weather satellite) infrared image. CloudSat is crossing the north-central Pacific Ocean on a descending orbit (from upper-right to lower-left) near a storm front. The radar data corresponding to this ground track (beginning in the center panel and continuing into the lower panel) shows a vertical cloud profile far more complex than the two-dimensional GMS-6 imagery would suggest. Thicker clouds and larger droplets are shown in yellow/red tones, while thinner clouds are shown in blue.
This article was provided by the Jet Propulsion Laboratory, California Institute of Technology, under a contract with the National Aeronautics and Space Administration.
All content is the responsibility of LUNAR.
If you have comments or suggestions regarding these web pages,
please contact the 
Copyright © 1992 - 2026 LUNAR